Basic Statistics: Overview
Basic Statistics: Main plots
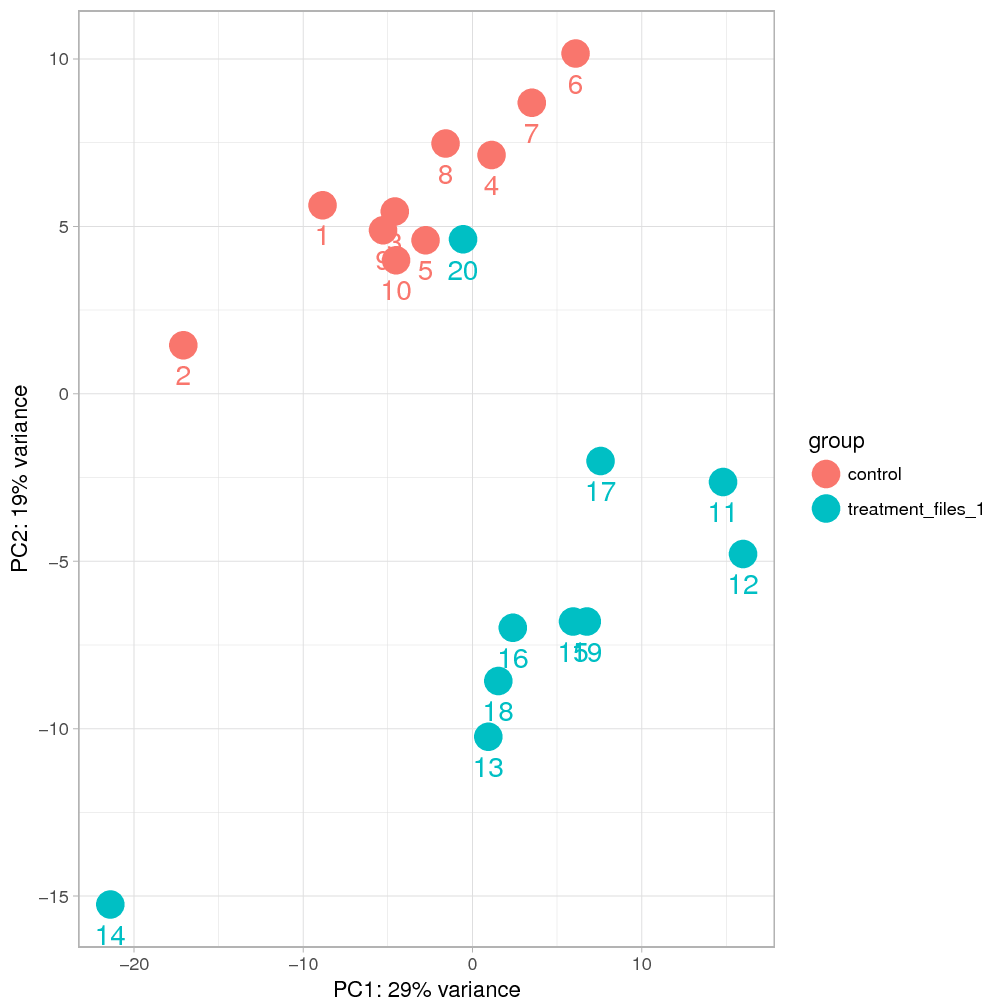
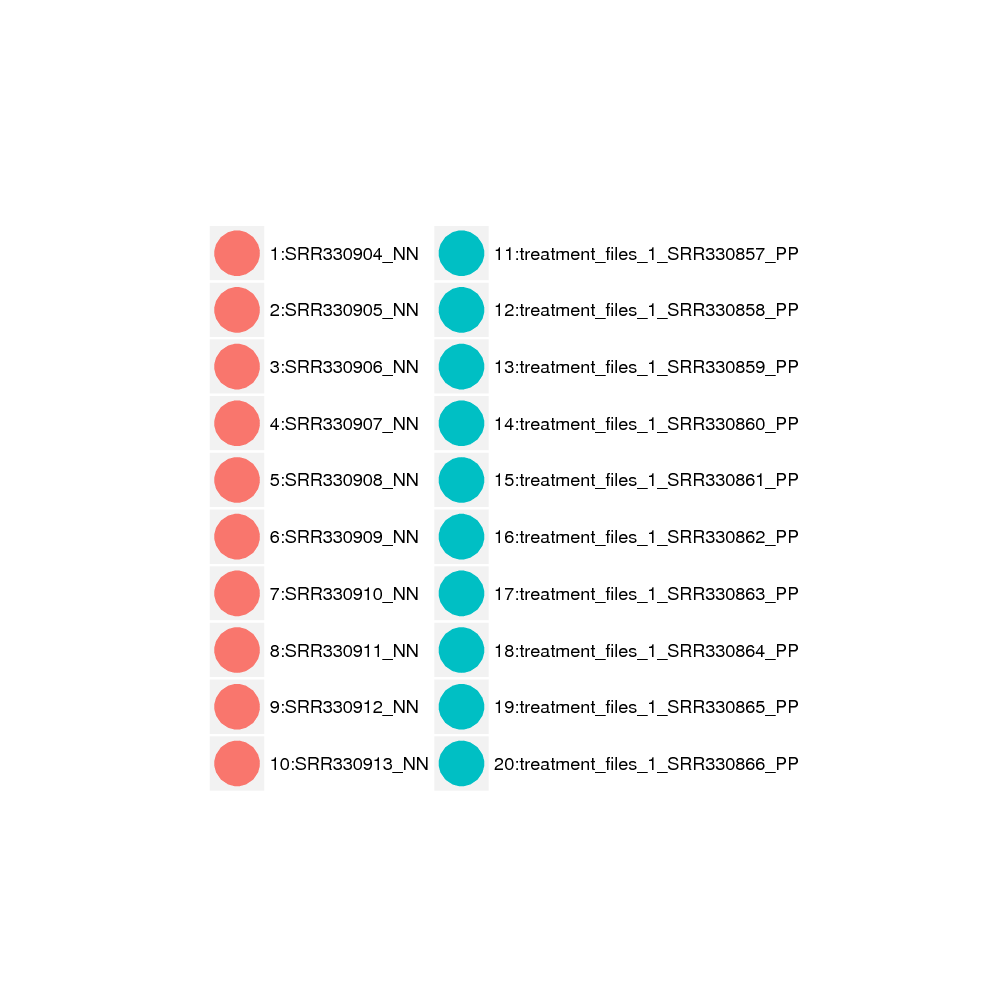
PCA sample distances
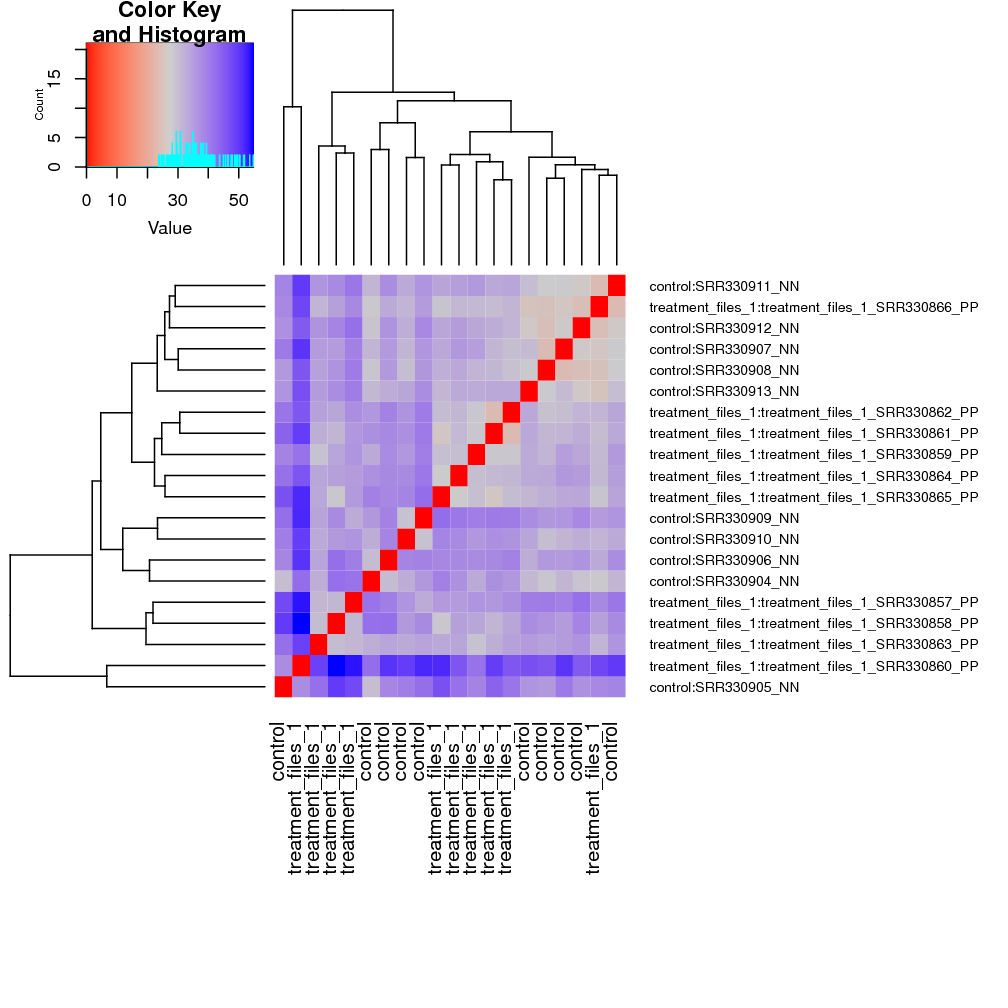
This heatmap represents the Euclidean distances between the samples of the experiment.

MA Plots
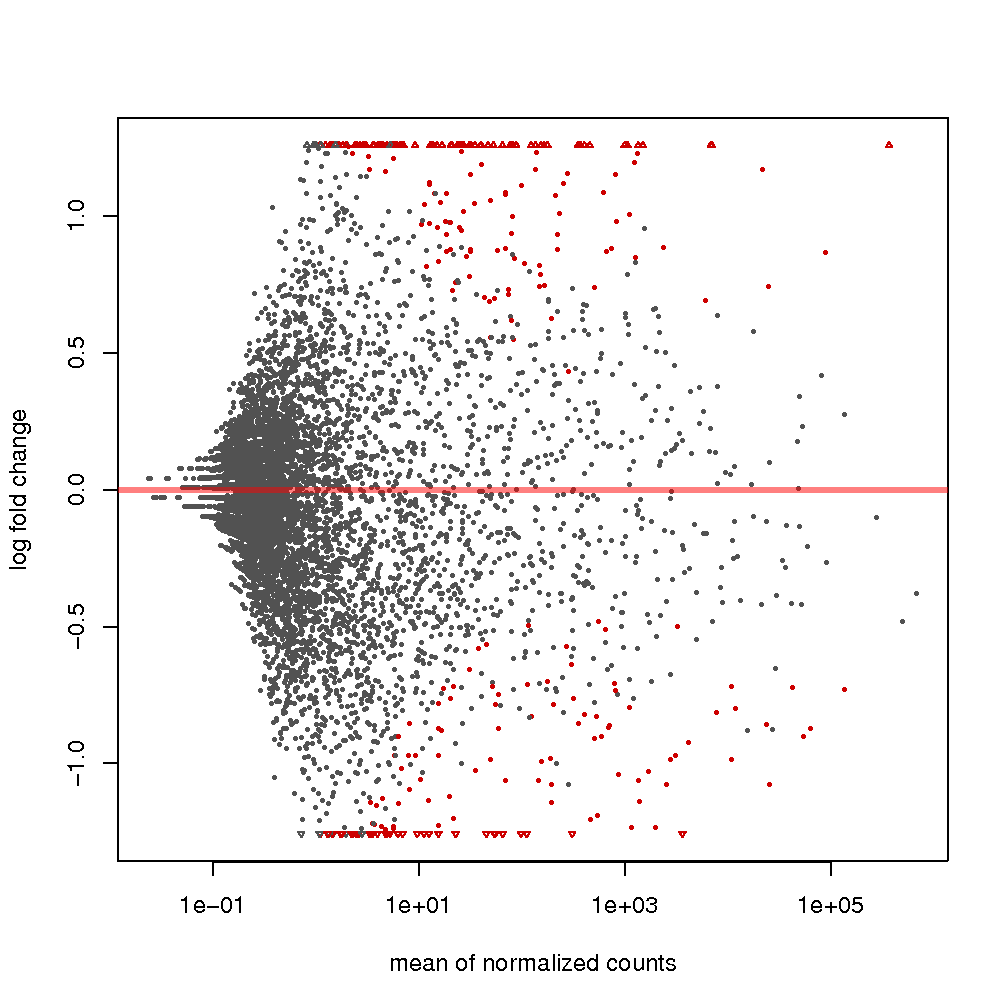
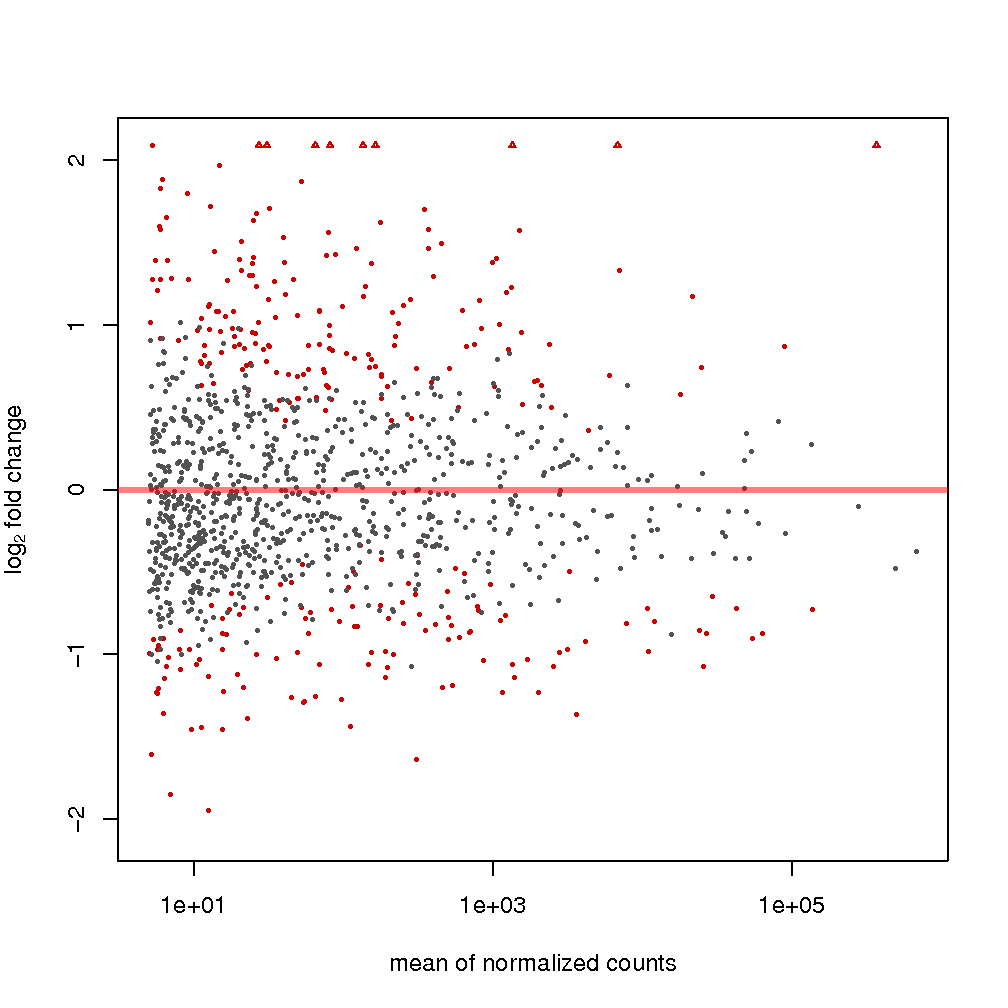
These 2 plots represent the log2 fold change over the mean expression of raw counts (on the left) and over the mean of normalized counts(on the right)


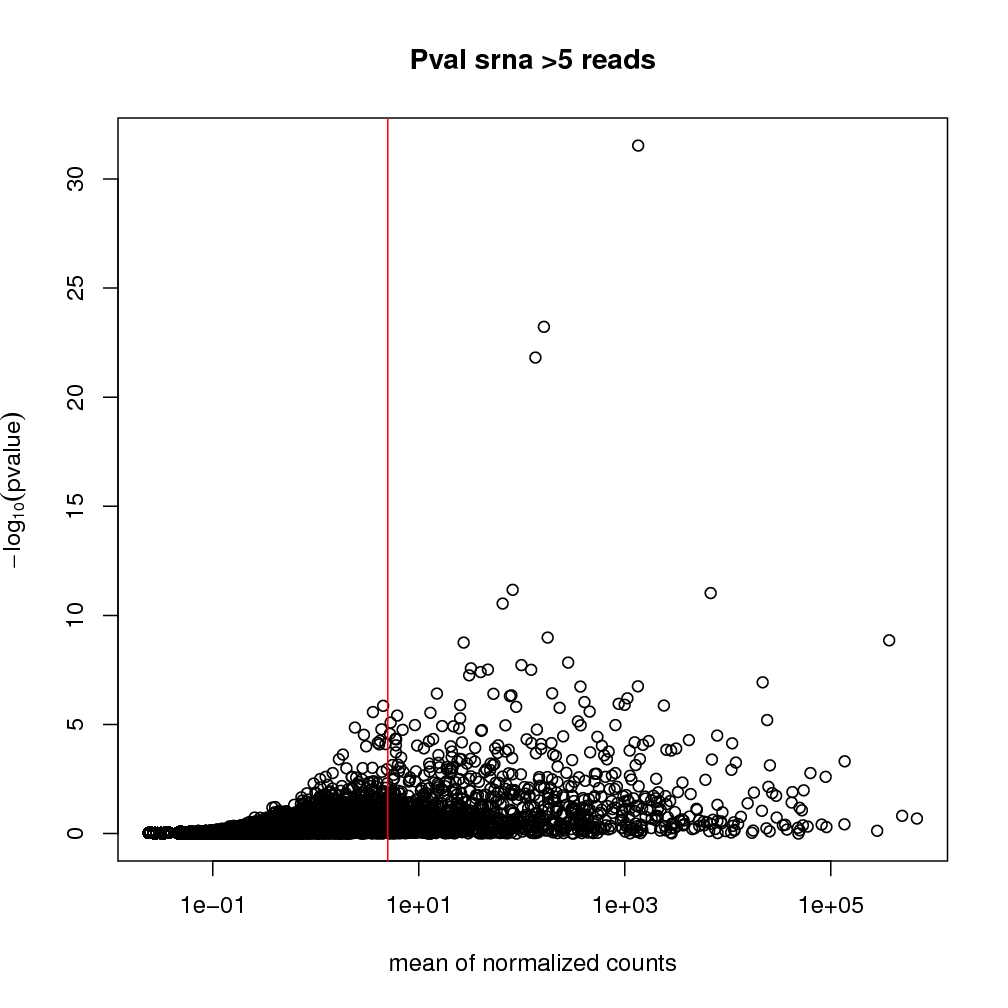
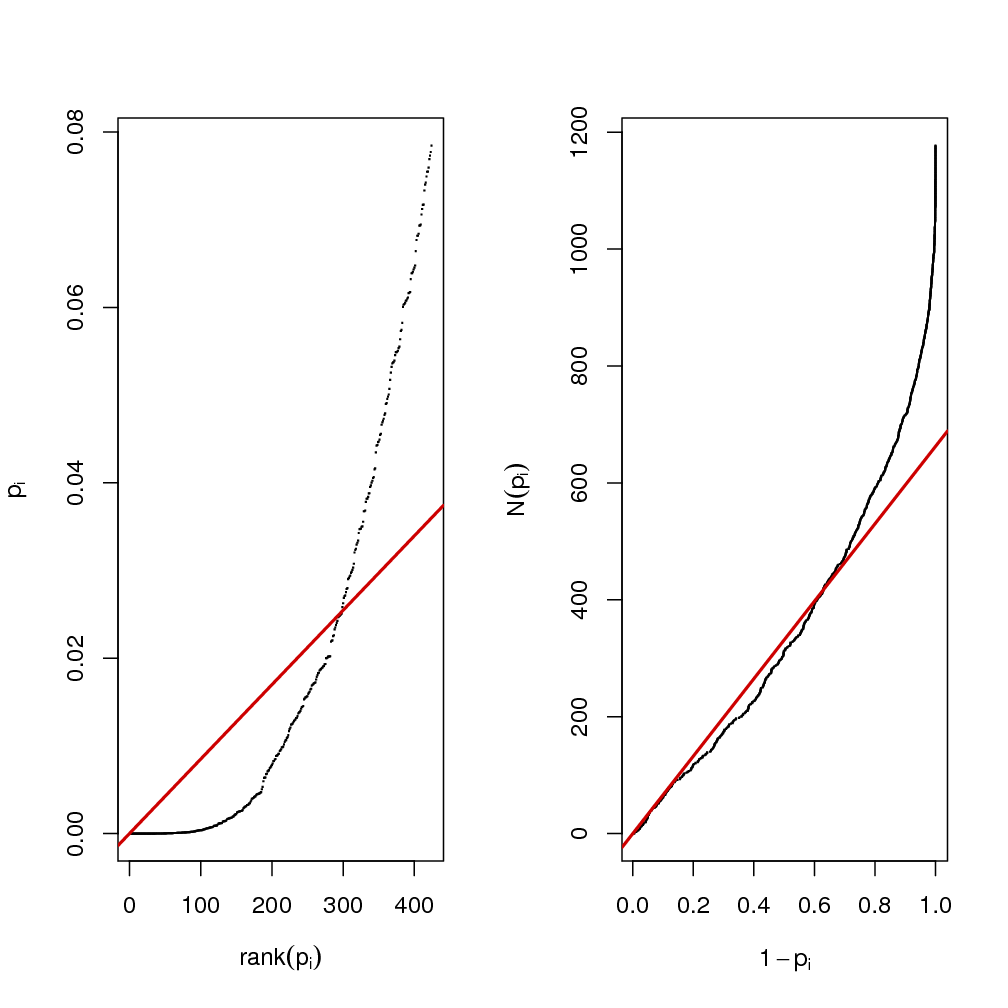
PValue Distribution
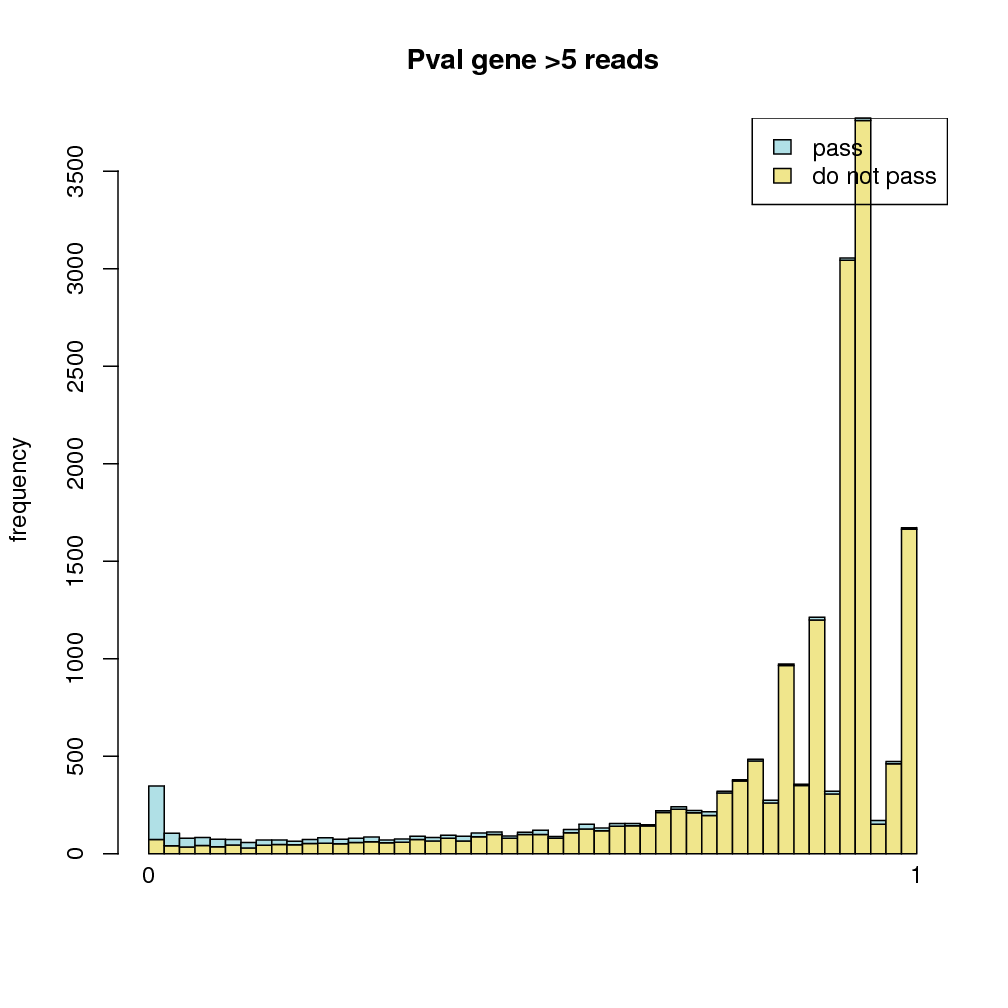
P-value distribution of sequences: in blue are those sequences with expression greater than 5, in yellow lower than 5

Top 30 most expressed sequences
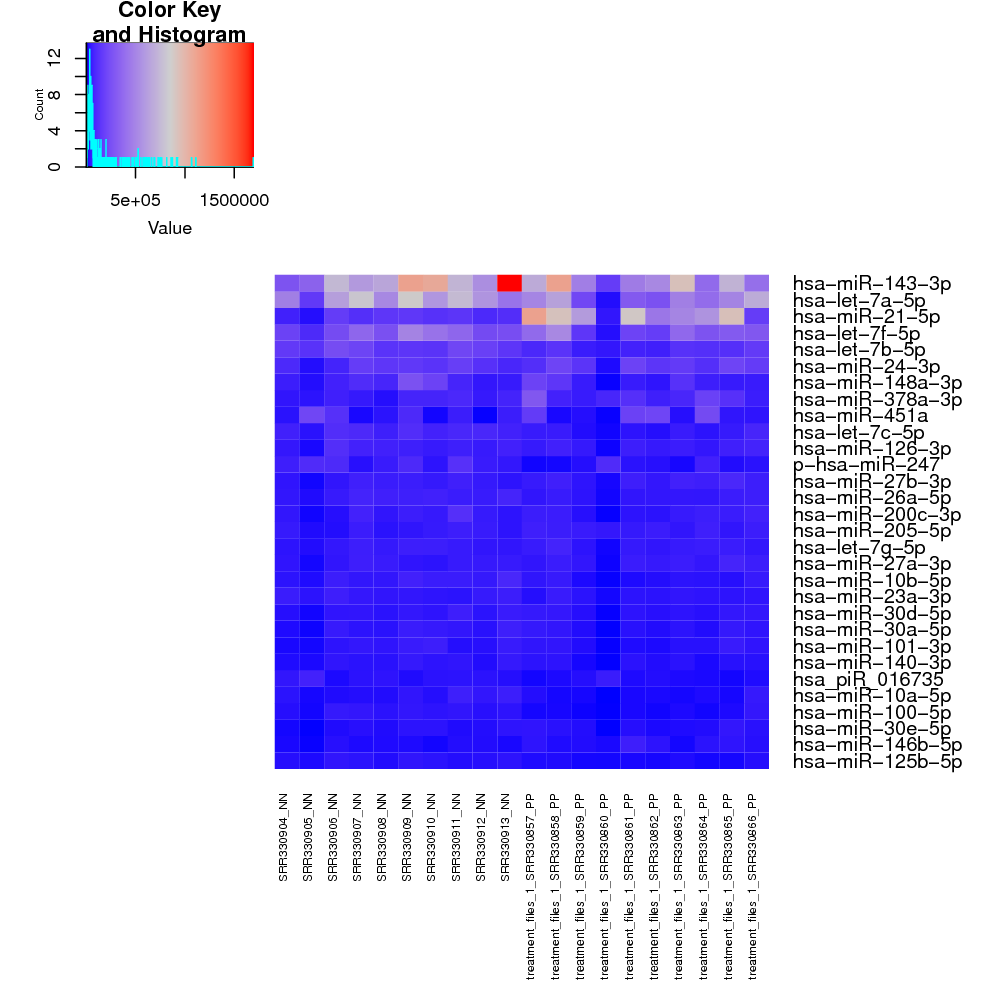
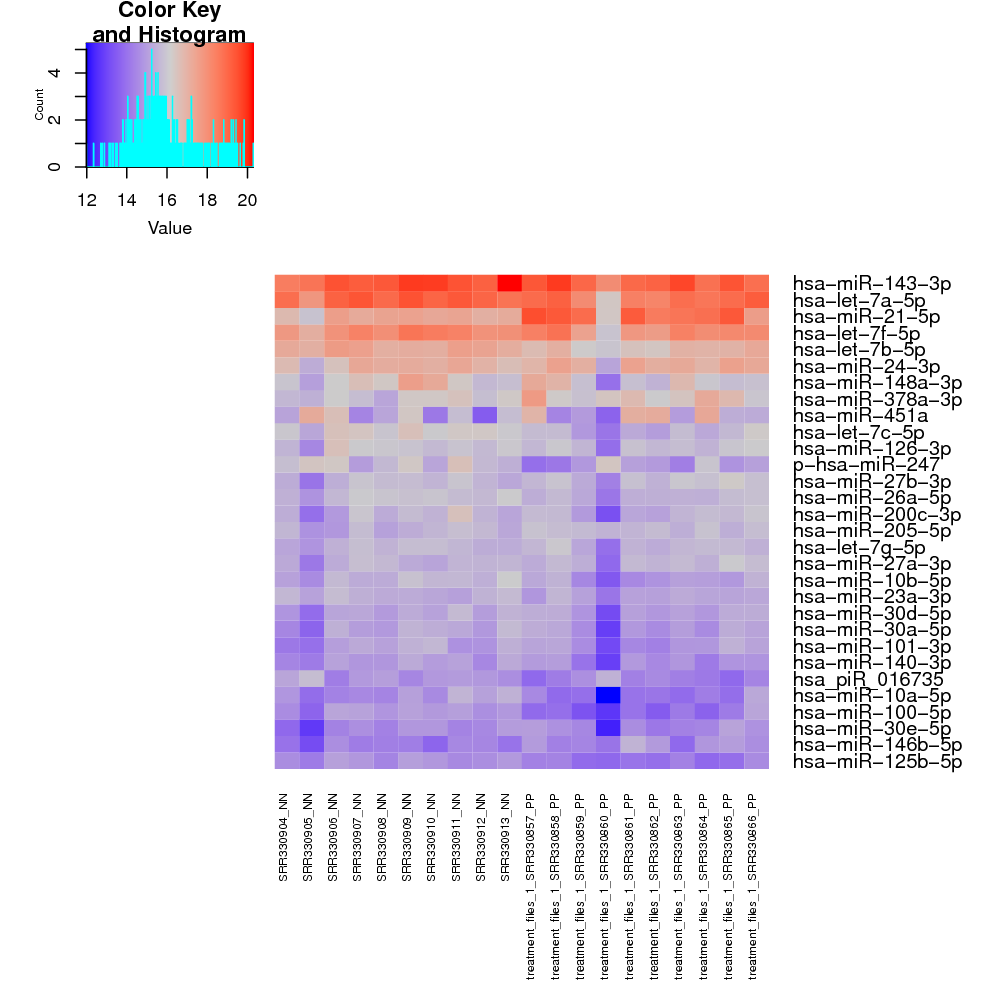
These heatmaps represent the expression data of the 30 most expressed sequences according with raw counts(left) and regularized log transformation(right)


All significant sequences (adj-pvalue below 0.1)
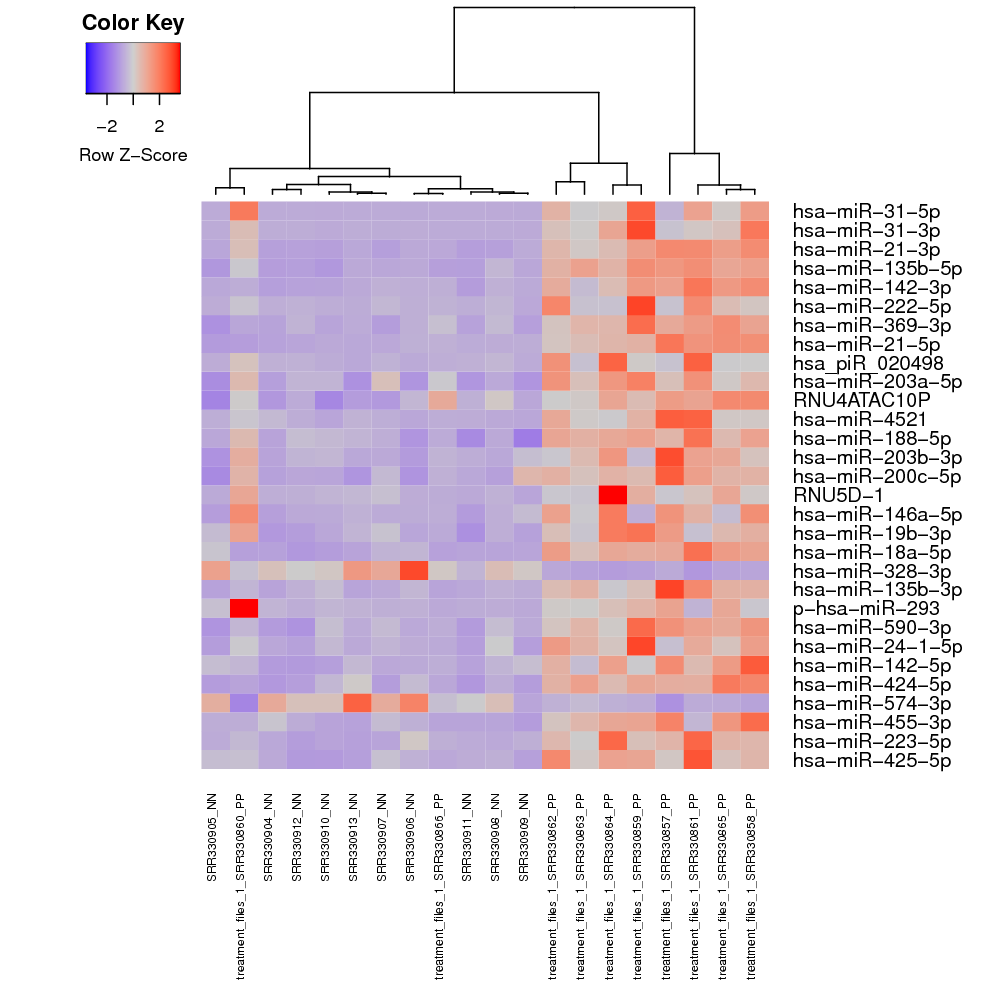
Expression data of the first 30 most significant sequences.

Citations
Oasis: online analysis of small RNA deep sequencing data.
Capece V, Garcia Vizcaino JC, Vidal R, Rahman RU, Pena Centeno T, Shomroni O, Suberviola I, Fischer A, Bonn S.
Bioinformatics. 2015
See online![]()
DESeq2
Love MI, Huber W and Anders S (2014). “Moderated estimation of fold change and dispersion for RNA-seq data with DESeq2.” Genome Biology, 15, pp. 550. http://dx.doi.org/10.1186/s13059-014-0550-8, http://dx.doi.org/10.1186/s13059-014-0550-8.
See online![]()