This is a short description of the output that you generated using the first part of the sRNA detection. To check the status of your samples please click here This analysis provides you with several quality plots to check if your experiment ran successful and also supplies the input for subsequent differential expression analysis (DE) and classification analysis
renal_cancer_5a1d95a31fb02
| Sample | Initial number of reads | % trimmed reads | % of uniquely mapped reads |
Quality control Show other PCA plots Description Novel miRNA
PCA all species
Trimmed reads
Reads per species (%)
Mapped reads
Read characteristics
miRNA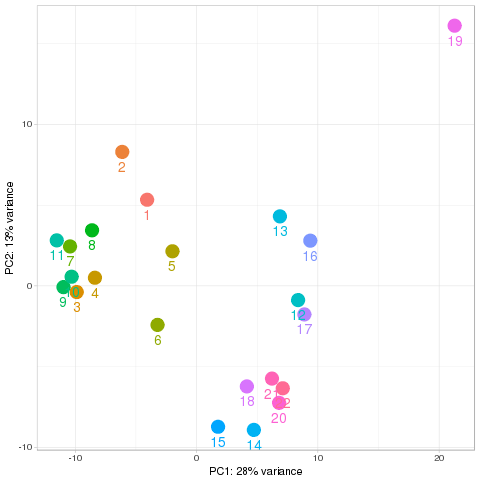 |
piRNA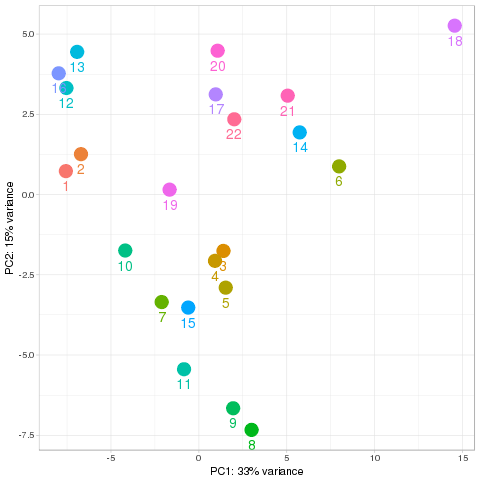 |
snoRNA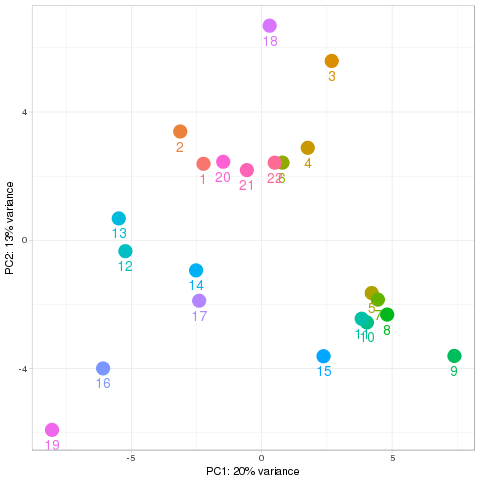 |
snRNA |
rRNA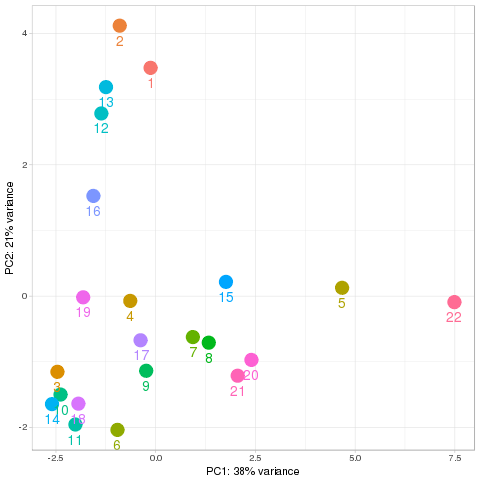 |
The miRNA prediction allows the user to detect novel miRNAs and use them in the differential expression (DE) analysis and in the classification tool.
The prediction is done in the total data (i.e., all the input samples are merged into a unique file containing the total reads) and it is executed by mirdeep2 software.
Mirdeep2 runs with the default parameters except by the minimum read depth (-a). This parameter is internally automatically computed according to the total number of uniquely mapped reads. This is chosen in order to obtain a ratio of 80% of true positive and a 80% recall. This step also reduces the running time by reducing the number of genome regions to make predictions.
The results can be visualized below and it shows detailed information about each predicted miRNA, including prediction scores, total mapped reads, similarity with another species miRNA, etc. Each predicted structure can be viewed by clicking in the provisional id link.
Note : Only predicted miRNA's that have miRDeep2-score >10, have no rfam alert, significant-randfold-p-value is yes and not known exon are added to the database.
Search Database
Download the output of Mirdeep2 as excel file