Basic Statistics: Overview
Basic Statistics: Main plots
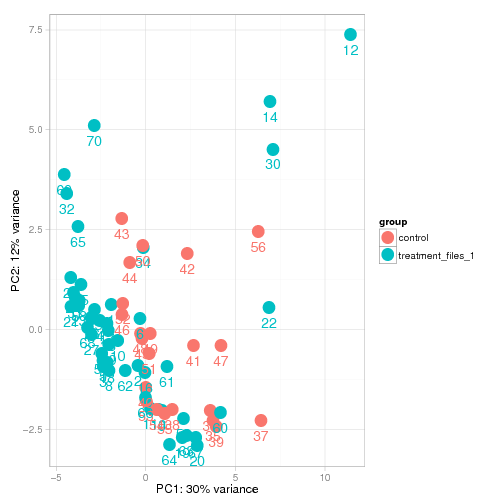
PCA sample distances
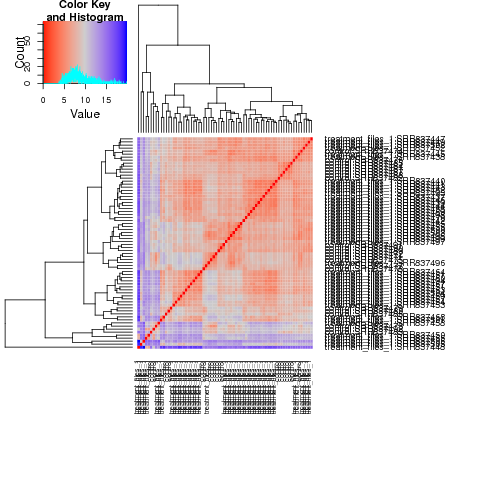
This heatmap represents the Euclidean distances between the samples of the experiment.
MA Plots
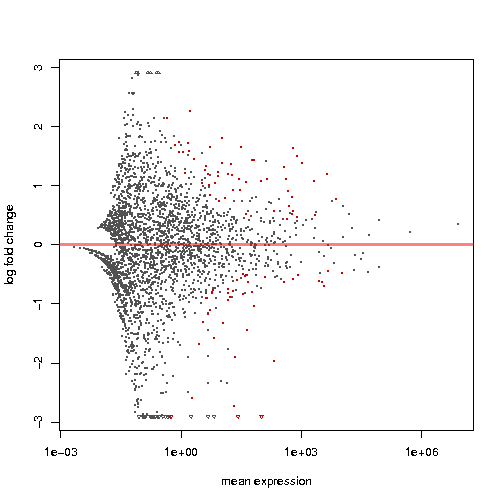
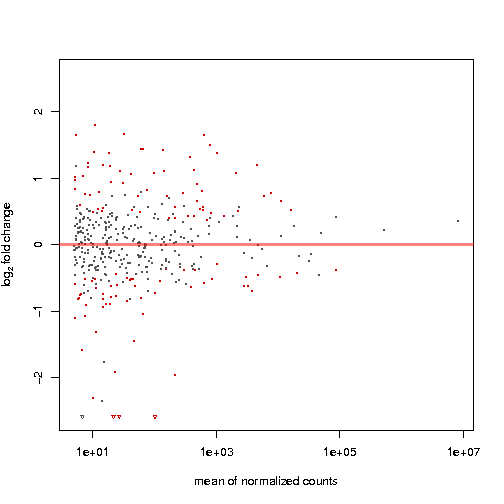
These 2 plots represent the log2 fold change over the mean expression of raw counts (on the left) and over the mean of normalized counts(on the right)
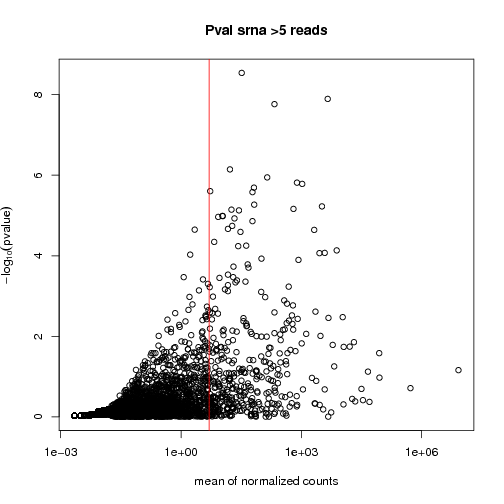
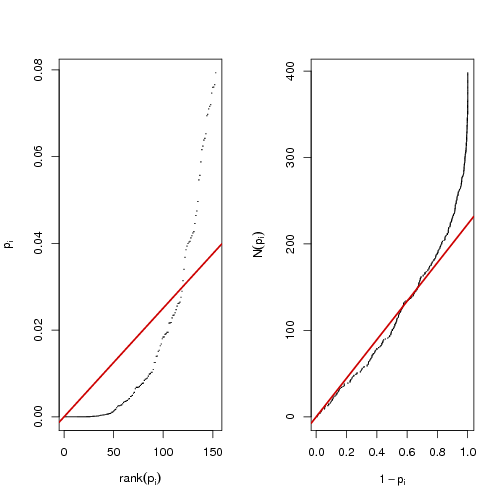
PValue Distribution
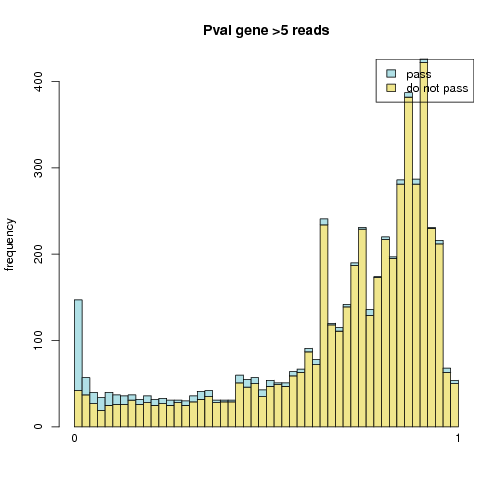
P-value distribution of sequences: in blue are those sequences with expression greater than 5, in yellow lower than 5
Top 30 most expressed sequences
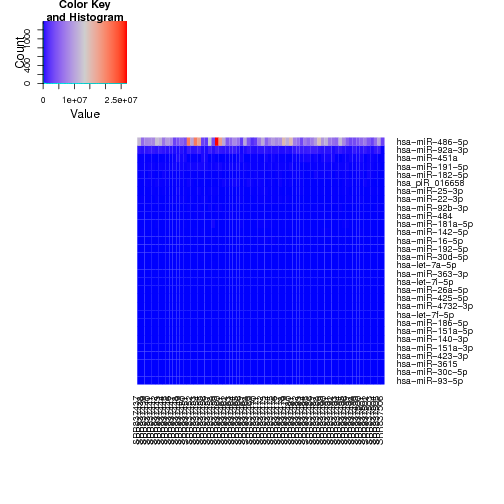
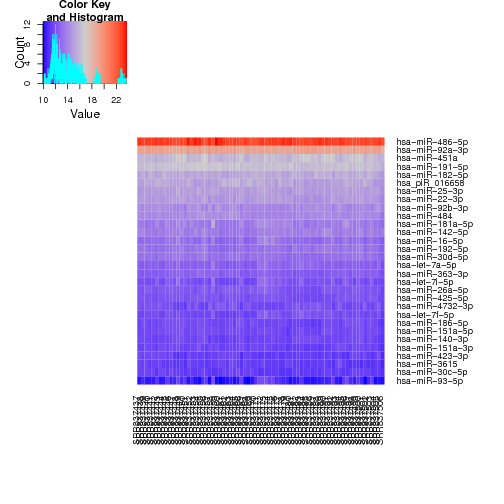
These heatmaps represent the expression data of the 30 most expressed sequences according with raw counts(left) and regularized log transformation(right)
All significant sequences (adj-pvalue below 0.1)
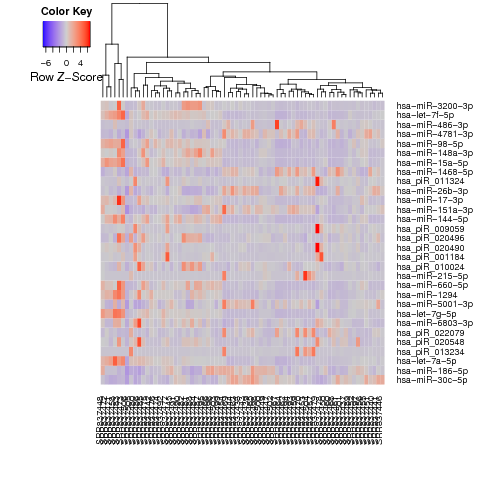
Expression data of the first 30 most significant sequences.
Citations
DESeq2
Love MI, Huber W and Anders S (2014). “Moderated estimation of fold change and dispersion for RNA-seq data with DESeq2.” Genome Biology, 15, pp. 550. http://dx.doi.org/10.1186/s13059-014-0550-8, http://dx.doi.org/10.1186/s13059-014-0550-8.
See online![]()